2020v1 UMDashboards Release
Overview
The 2020v1 release of UMDashboards sunsets Flash and is the first version of our fully functional HTML interface. Users are no longer required to install and run Flash on their browsers. Dashboard navigation and functionality has remained consistent in the HTML interface with a few exceptions. Here’s an overview of the user interface changes:
- Exporting Data:
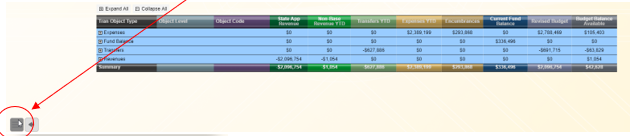
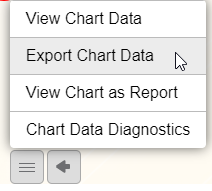
Right clicking functionality has been removed. Users can no longer right click on a chart to Export Data. Users can now export a chart’s data by:- Exporting Chart Data: Where applicable, click on the hamburger menu in the bottom left corner of the chart and choose “View Chart Data”:
- Exporting Chart Data: Where applicable, click on the hamburger menu in the bottom left corner of the chart and choose “View Chart Data”:
- The chart’s data should immediately start to download. In the Chrome browser the .csv file should be available at the bottom of the browser window as shown below. Alternatively, you should be able to retrieve the file in your Downloads folder.
- Exporting All Dashboard Data:
Under the Settings Hamburger menu

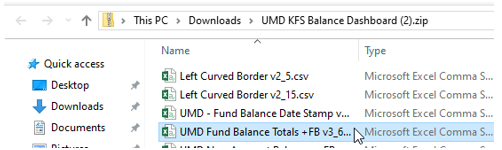
The Export All Chart Data allows users to export all underlying data used to develop the charts in the dashboard. Upon clicking on the Export All Chart Data option, the application will begin downloading all chart data into a zip folder. Users can then open the zipped file and select the .csv file they would like to review:
- Dashboard Navigation:
Navigating the dashboards will work very similar in this release as it has in prior releases by utilizing the dashboard launcher or homepage to select a category (Financial or Research), click on a dashboard image and launching a dashboard.
Some of the icons have changed including:
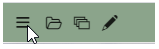
Opening a dashboard is the open folder located at the top left of the application browser:

Opened Dashboards in a session can be found using the “Switch Icon”:

- Navigating back to a dashboard can be accomplished by click the back arrow:

- Drilldowns – unchanged
- Drilling Up Icon has changed to:

Enhancements
Some of the dashboards have been enhanced to improve load time performance or the visual experience of the dashboard.
- UMD Awards by PI
- Includes five (5) fiscal years of data.
- General changes to select chart types to improve data rendering experience.
Revised Training Resources
The Dashboard & Analytics Team has updated the website to include revised training materials including: